fbpx
TwoSix Digital
  • Home
  • About TwoSix
  • Digital Marketing Services
  • Case Studies
  • Blog
  • Our Team
  • Contact
  • Menu Menu
  • Twitter
  • Facebook
  • Instagram

Search

State Tourism Website Traffic Analysis – Q1

May 8, 2019

This week, we published the first website traffic analysis for the 50 official state tourism offices. The analysis was conducted by TwoSix Digital to benchmark and rank traffic to each tourism organization’s website. The analysis ranked each state by total traffic, average monthly visits, share of mobile vs. desktop and engagement factors like pages per visit, average visit duration and bounce rate. 
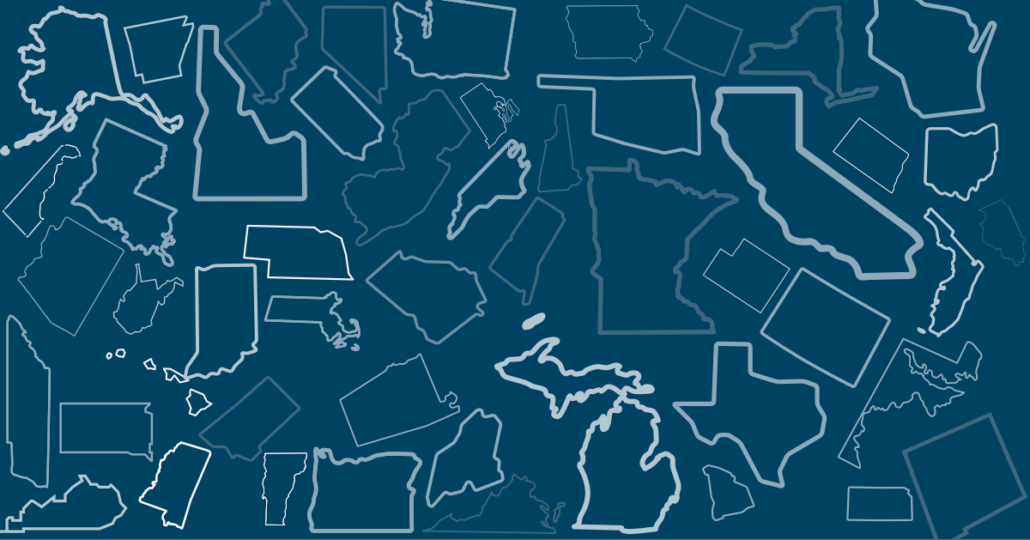
The state of California currently leads all tourism offices with more than 7 million website visits in the first quarter of 2019. They topped the scale ahead of second place Florida by more than 4 million website visits.   Rounding out the rest of the top five are Hawaii, Colorado and Michigan in terms of total website visits in the months of January through March.

An interesting note was the dominance of mobile traffic–more than 77% of the website visitors accessed the state tourism websites via their mobile device. 

All of the data was gathered via SimilarWeb, a third-party traffic and website analysis application. SimilarWeb’s innovative marketing intelligence allows users to gain insight into any website’s statistics through a global panel of consumers that work across a range of devices and websites. 

The state with the most engaged traffic was Washington, followed by Alaska, Connecticut, Delaware, and Massachusetts.  By using a weighted scale based on the number of page visits, time on site and bounce rate, we calculated the overall engagement rate on a scale from 1-10, then ranked the states from 1 to 50.

Another interesting note on the complete data set was that even though California had the most overall traffic, they produced the least engaged traffic based on our engagement scale ranking.

We do realize these numbers will not be “apples to apples” in terms of overall website visits recorded through Google Analytics or other tracking software installed on an individual website. But, by collectively recording the aggregate data for all 50 states from an identical source utilizing the same methodologies, we will be able to draw a very accurate analysis of the traffic positioning.

The traffic analysis will be updated each quarter throughout 2019. In those updates, we will include additional insight into how consumers utilize state tourism websites.  The full year of analysis will even out seasonality trends and provide a more complete view of each tourism office’s website traffic and engagement metrics.

Click here to download the complete data set and the infographic!

Download the complete data set for the State Tourism Website Traffic Analysis – Q1 2019 


Share this entry
  • Share on Facebook
  • Share on Twitter
  • Share on Pinterest
  • Share on LinkedIn
  • Share on Tumblr
  • Share on Reddit
  • Share by Mail
https://twosixdigital.com/wp-content/uploads/2019/05/State-Tourism-Graphic.png 609 600 2sixdigitaltwo6 https://twosixdigital.com/wp-content/uploads/2019/01/TwoSixDigital_logo_Stacked_RGB-300x142-300x142.jpg 2sixdigitaltwo62019-05-08 08:00:152020-10-16 14:48:25State Tourism Website Traffic Analysis – Q1
You might also like
6 Best Practices for Email Subject Lines
Digital Engagement Ranking: US Tourism Office Edition, QTR 3, 2104
What Website Pixels You Need and How To Install Them
4 Easy Ways to Get to Know your Digital Audience
Social Engagement Custom Audiences and Likes vs Favorites
5 Reasons To Use Pinterest To Promote Your Destination

Check out our new articles:

  • On Our Radar Highlight – Pinterest Predicts is Here, Choo Choo! January 19, 2023
  • On Our Radar Highlight – Yes, You Can Use ChatGPT For Destination Marketing January 19, 2023
  • On Our Radar Highlight – TikTok to be Banned in America? Maybe? January 17, 2023
  • Vertical Video Trends, Best Practices, and How To Get Started with TikTok, Reels, and YouTube Shorts January 11, 2023
  • Why & How to Cleanse your Email List January 10, 2023

Stay up to date with our monthly newsletter!

TwoSix on Tour

March 20-22 | Brian Matson will be attending the Indiana Tourism Conference and presenting a Digital Marketing Workshop.

© Copyright - TwoSix Digital | 209 W. Main Suite 107, Brighton MI 48116 | 810-623-1505
  • Twitter
  • Facebook
  • Instagram
TwoSix Digital Reflects on Why Travel MattersHow to Combat Dark Traffic in Google Analytics
Scroll to top

This site uses cookies. By continuing to browse the site, you are agreeing to our use of cookies.

OKLearn more

Cookie and Privacy Settings


How we use cookies

We may request cookies to be set on your device. We use cookies to let us know when you visit our websites, how you interact with us, to enrich your user experience, and to customize your relationship with our website.

Click on the different category headings to find out more. You can also change some of your preferences. Note that blocking some types of cookies may impact your experience on our websites and the services we are able to offer.

Essential Website Cookies

These cookies are strictly necessary to provide you with services available through our website and to use some of its features.

Because these cookies are strictly necessary to deliver the website, refusing them will have impact how our site functions. You always can block or delete cookies by changing your browser settings and force blocking all cookies on this website. But this will always prompt you to accept/refuse cookies when revisiting our site.

We fully respect if you want to refuse cookies but to avoid asking you again and again kindly allow us to store a cookie for that. You are free to opt out any time or opt in for other cookies to get a better experience. If you refuse cookies we will remove all set cookies in our domain.

We provide you with a list of stored cookies on your computer in our domain so you can check what we stored. Due to security reasons we are not able to show or modify cookies from other domains. You can check these in your browser security settings.

Google Analytics Cookies

These cookies collect information that is used either in aggregate form to help us understand how our website is being used or how effective our marketing campaigns are, or to help us customize our website and application for you in order to enhance your experience.

If you do not want that we track your visit to our site you can disable tracking in your browser here:

Other external services

We also use different external services like Google Webfonts, Google Maps, and external Video providers. Since these providers may collect personal data like your IP address we allow you to block them here. Please be aware that this might heavily reduce the functionality and appearance of our site. Changes will take effect once you reload the page.

Google Webfont Settings:

Google Map Settings:

Google reCaptcha Settings:

Vimeo and Youtube video embeds:

Other cookies

The following cookies are also needed - You can choose if you want to allow them:

Privacy Policy

You can read about our cookies and privacy settings in detail on our Privacy Policy Page.

Privacy Policy
Accept settingsHide notification only