Tag Archive for: Facebook

Lead Ads and Ignored Messages

Lead Ads and Ignored Messages

Facebook Unveils Lead Ads

Lead Ads

Credit: Shutterstock

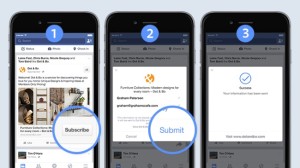
Facebook wants to make it easier for people to fill out forms to subscribe or sign up for services or programs through the use of lead ads. Lead ads work by auto-populating information in forms for newsletters, asking for follow-up calls or a price estimate.

Essentially, it’s more of a one-stop shop option that keeps users from jumping page-to-page, which can lead to people becoming disinterested and stopping the process. These ads will also provide instant information and data for marketers. The image to the right provides a great visual representation of what a lead ad would look like. Right now, the ads are only available to a select number of advertisers.

Customer Messages go Ignored

Any social media manager can tell you that a large amount of messages they receive on their channels is spam or completely irrelevant…but are 87% of those messages such? A new Locowise report measured 900 Facebook pages and found a whopping 87% of customer messages went completely ignored. Less than stellar customer service, you might say. Additionally, of the pages that did respond to messages, only 37% of their messages went answered.

It’s not all bad news, though. More than 60% of messages that received a response were communicated with in 2-4 hours. As previously mentioned, a large number of irrelevant posts  and messages are sent to social networks. No one is denying this, but in order to provide an excellent level of customer service that is expected from social media it may be beneficial to give our pages or inboxes another look – or look a bit more frequently.

Changes Coming to Facebook Ads

Changes Coming to Facebook Ads

Some interesting new upgrades and changes are coming to Facebook ads! The social network made the announcement this week in order to prepare ad managers for what to expect. Facebook says the plan is to work harder for ad managers so they don’t have to work quite so hard (yay!) Here is a short breakdown of what to expect:

Ads Manager

A new layout will streamline the look in Ads Manager and provide more information on ads’ performance.

The new data will display performance, audience and placement results. Doing so will provide managers a view of the performance of an ad when making necessary edits instead of memorizing details or having a second window open. This information can even be filtered and selected by date. Reports can also be set to send out at intervals to provide updates as needed, meaning updates can be provided easily and frequently to show progress.

Power Editor

While the changes in Power Editor may not be as drastic, the new and improved Power Editor will boast a larger display and an edit pane. This will provide more room and a quicker way to edit ads. Ads may also be searched by name or ID and be filtered.

Overall, Facebook says these changes are designed to help ad managers speed up and enhance the ad creation, editing and reporting process. The changes will roll out to all ad accounts in the coming months with no set date announced yet

"Nearby" Traffic, Facebook Restaurant Reviews and a Social Infographic

Nearby searches double

Credit: The Next Web

“Near Me” Traffic Doubles Year-Over-Year

Users are increasingly using Google to discover local businesses and locations. Google reports that searches with the words “nearby” or “near me” have doubled year-over-year. Understandably, 80% of those searches came from mobile.

This new data only reinforces the importance of businesses and locations registering and ensuring they show up in Google searches.

Facebook Testing out Critic Reviews of Restaurants

An interesting new move by Facebook will bring critic reviews of select restaurants to the platform. Previously, user reviews were already available, but this recent change is the first time anything “official” will appear for reviews of restaurants.

While Facebook says the change is due the the social nature of the platform and providing users with a better experience, it could also be inferred that the move could be designed to take traffic away from other review sites, like Yelp.

Ideal Photo Sizes for Social

While it isn’t necessarily breaking news, a new infographic indicating the ideal photo sizes for the major social networks was published this week. Many businesses and people struggle getting a photo that is the right size published in their posts and on the profile pages. Utilizing the information in this graphic and a photo resizing tool, like Pixlr, can guarantee you’re publishing content that is sized correctly!

Case Study: Pure Michigan Million Page Likes

PureMILogoClient:
Pure Michigan


The Scope:

Pure Michigan assigned TwoSix Digital the task to increase its Facebook page Likes to over one million. This made Pure Michigan the third statewide tourism page behind Hawaii and New York to cross this mark. Additionally, TwoSix Digital was asked to change the location origin of the Facebook users from predominately in-state to out-of-state.

The Strategy:

Beginning in February and ending in May, 2015 TwoSix Digital developed and ran 269 unique ad sets using 13 custom audiences and 24 lookalike audiences.

The ads were targeted to consumers based upon suggestions from the Facebook Audience Insights tool and included interests, locations, brands and specialties that Michigan is known for.

Additionally, TwoSix Digital used Pure Michigan’s Google Analytics to determine targeted states and DMAs along with website pixels to help leverage traffic to michigan.org to reach a deeper and more relevant audience.  Pure Michigan Lighthouse Ad

The Results:

With TwoSix Digital’s strategy, Pure Michigan successfully reached its goal with more than 290,000 Page Likes. The campaign also obtained move than 15 million ad impressions.

A major KPI included shifting the percentage of page likes from in state to out of state. When the campaign began, only 40% of the state’s Facebook Audience was from out of state. When the campaign was completed, the audience was comprised of 52% out of state residents.

The campaign goals and KPI’s were all achieved ahead of schedule and under budget despite Facebook’s purge on March 14th of inactive or memorialized accounts.

Pure Michigan Page Likes Growth

Post Frequency, a Facebook/IBM Partnership and Mobile Relevance

Facebook Post FrequencyHow Many Facebook Posts Per Week?

The question constantly being asked: how often should we post on our Facebook page? There is no right answer, nor a silver bullet to magically reach every one of your page fans. However, Locowise did some digging and came across some interesting data after looking at more than 600 Facebook pages.

The full Locowise article may be read here but, suffice it to say, less may be more on Facebook:

  • Pages that posted once per week or less frequently reached an average of 15 percent of users who liked their pages with each post.
  • Pages that posted one to four times per week saw engagement from 12 percent of users that they reached.
  • Those that posted once daily reached 8.42 percent of their audience.
  • Those that posted once per day registered 10.84 percent engagement.

Big Blue and Facebook Team Up for Targeting

A new partnership between Facebook and IBM wants to make it easier for big brands to target their desired audience with ads. The deal would work by IBM allowing Facebook to target more Fortune 500 companies with ads while selling IBM’s marketing cloud services.

The companies note that marketers, particularly retailers, may benefit the most from the partnership, but the ability to more effectively target ads is beneficial to anyone creating and managing an ad campaign.

Mobile Gains on Desktop

It’s certainly one of those things we’ve heard for a long time: mobile will one day surpass desktop in searches. While that may not universally be the case (yet), a recent Google AdWords blog indicates that’s the case in at least 10 countries – including the U.S. and Japan. This coincides with some recent reports on the importance of mobile, including one from eMarketer indicating more ad dollars will be spent on mobile than desktop in 2015.

Social Ad Spending, Amazon Destinations and Facebook Algorithm Changes

Facebook Advertising

Credit: Chalk & Ward

Global Facebook Ad Spend

You’ve heard it before: social media is becoming pay-to-play, and a new report seems to indicate that statement really is on the money. A new report from eMarketer estimates global spending on social media advertising will total $23.68 billion. That’s “billion” with a “b”.

Most of the money will be spent on Facebook, roughly 65.5% of it. However, Twitter is gaining share and is expected to bring in about 7.1% more revenue this year, bringing it to about $2.09 billion. While still nothing to brush off, LinkedIn is expected to earn $900 million in ad revenue in 2015 – a dip from 2014.

Amazon Destinations Debuts

Amazon seems to be getting in on the travel and tourism game with the launch of its new hotel product and brand, Amazon Destinations. Destinations works directly with hoteliers and mainly operates to help with weekend getaways or road trips near major metropolitan areas, meaning you won’t see flight options or deals.

Skift reports the focus is to help people looking for that weekend away and to boost local travel. Destinations differs from Amazon Local by favoring published rates and working with hotels for an ongoing basis and not just when rooms need to be filled. The service is still in its infancy and reviews are minimal compared to the 200 million currently on TripAdvisor, though some do appear.

Facebook Plays with its Algorithm…Again

A change to Facebook’s algorithm will increase the updates from friends seen and decrease what’s seen about their activity on Facebook. What does this mean? You’re less likely to see content your friends like or comment on in your Facebook newsfeed, meaning brand pages that rely on audience activity for virality may go down. While Facebook says the move was done to give more relevant content to users one can’t help but wonder about inevitable step closer toward the play-to-pay model for brands to get content seen.

Likes Decline, Mobile Boarding & Travel Surveys

Facebook Cleans up Page Likes and Adds New Tool

Topic DataBrand managers could see a drop in the number of Facebook page likes on their pages. The social network recently announced it would remove likes on pages that come from deactivated or memorialized (pages kept active for the deceased) accounts. Facebook says that most pages shouldn’t see a significant drop in the number of likes and the change should provide more accurate insights for brands.

On the plus side, a new tool from Facebook may provide more information to brand managers looking for information on what target customer demographics are saying about topics of interest. Facebook, working with Data Sift, developed what it calls Topic Data. Facebook says Topic Data “Topic Data shows marketers what audiences are saying on Facebook about events, brands, subjects and activities.” The tool launched earlier this week and has limited availability at this time.

UPDATE: Some of the pages managed by TwoSix Digital and other professionals in the industry we communicate with are ranging anywhere from a decline of .02% of their total audience to as much as 4.3%.

Mobile Boarding

If a new report is to be believed, 1 in 3 boarding passes for airplanes will be delivered by mobile devices by 2019.

Juniper Research claims the number of people using their mobile devices as boarding passes will continue to rise exponentially. Juniper notes that proximity sensors in devices through apps will likely become the dominant way we check in and use passes but, for now, bar codes displayed on devices will continue to grow in use and popularity.

Travel Survey Results

Travel marketers and industry professionals can now get their hands on the latest TripBarometer report from TripAdvisor. The report surveyed more than 44,000 travelers and hoteliers to get their thoughts and travel practices. You can take a closer look at the report – broken down into a handy infographic – here.

Additionally, you can also check out a new report focusing on millennials and travel was also released by Yahoo Travel.