by TwoSix Digital | Jul 14, 2022 | Digital Marketing Strategies, Media, Social Media
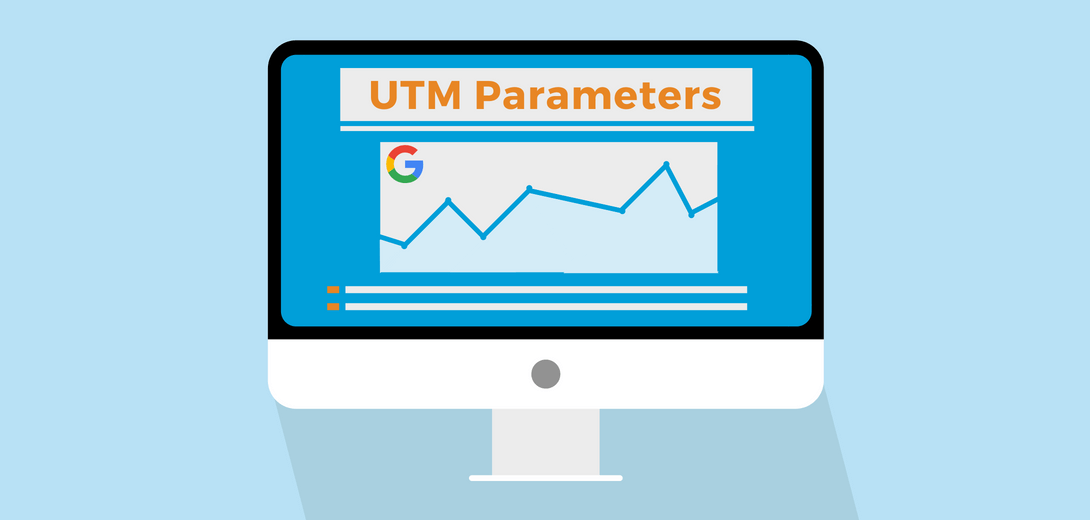
When you hear “UTM codes,” you may think that it’s far too complicated to try and understand. Instead, try to think of them like “nametags” for your link to make them more digestible. These ‘name tags’ appear in analytics reports and let a website know exactly where...
by TwoSix Digital | May 8, 2019 | Media, News
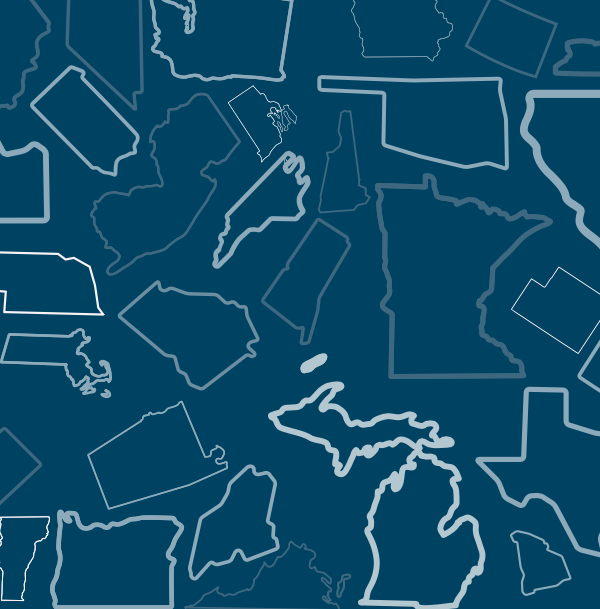
This week, we published the first website traffic analysis for the 50 official state tourism offices. The analysis was conducted by TwoSix Digital to benchmark and rank traffic to each tourism organization’s website. The analysis ranked each state by total traffic,...